Pythonで日本地図の作成に挑戦します。
かなり長編になりますので、
時間のない方は最後まで飛んでいただいて結構です。
国土数値情報ダウンロードサイトから、
全国の行政区域データを入手します。

(下にスクロール)

(行政区域を選択)

(下にスクロール)

(全国をダウンロード)

ダウンロードされたZIPファイルを展開します。
(ダウンロードフォルダに保存されるはず)
(N03-20220101_GML.zipを右クリック→すべて展開)

展開されたフォルダを移動します。
(上の~.zipは削除しても問題なし)

WSL内の任意のフォルダに移動したら、
意味不明のファイルができていました。

削除しても問題なさそうなので、
私は削除しました。
Jupyter Notebooksで内容を確認します。

import geopandas as gpd
gdf = gpd.read_file("/home/yasube873/Python/weather/map/N03-20220101_GML/N03-22_220101.shp")
display(gdf)
最新版(令和4年)をダウンロードしたら、
北海道の支庁区分が表示されないようです。
(N03_002に表示なし)

令和3年分をダウンロードします。
(『こちら』を選択)

(一番下にある全国令和3年をダウンロード)
(この後は令和4年をダウンロード後と同様の作業)

import geopandas as gpd
gdf = gpd.read_file("/home/yasube873/Python/weather/map/N03-20210101_GML/N03-21_210101.shp")
display(gdf)
表示されました。
(N03_002に表示あり)
Pythonで都道県境と北海道の支庁を表示させるように試みたのですが、
どうにもうまくいかず。
QGISを使うことにします。
インストールしているQGISは、
GMT対応のためバージョンが古いので、
最新のものをインストールします。
(QGISのインストールについては割愛します)

デスクトップに表示されているQGISのアイコンに、
シェープファイルをドラッグ&ドロップします。

QGISが開かれると、
市区町村区分の日本地図が表示されます。

マウスカーソルをベクタに移動し、
マウスカーソルを空間演算ツールに移動すると表示される
融合(dissolve)を選択します。

赤枠(四角)を選択します。

『N03_001』と『N03_002』を選択し、
『OK』ボタンを押下します。

赤枠(四角)ボタンを押下し、
『ファイルに保存』を選択します。

エクスプローラーが表示されますので、
保存したいフォルダを選択します。

赤枠(四角)ボタンを押下し、
『SHP files(*.shp)』を選択し、
ファイル名を記述します。


『実行』ボタンを押下します。


『終了しました』と表示されたら、
『閉じる』ボタンを押下します。
大まかにはできたのですが気になる所があります。


意味不明な線が表示されていますので消去します。

『N03-21_210101』を右クリックし、
マウスカーソルをエクスポートに移動、
『新規ファィルに地物を保存』を選択します。


赤枠(四角)ボタンを押下し、
『Geo Json』を選択します。

赤枠(四角)を選択します。

エクスプローラーが表示されますので、
保存したいフォルダを選択します。

ファィル名に拡張子は記述しないで『保存』ボタンを押下します。
この状態は一時保存を表しているようで、
実際には保存されません。

レイヤオプションのCOORDINATE_PRECISIONの数字を『5』にして、
『OK』ボタンを押下します。

デスクトップに保存されたgeojsonファイルを
デスクトップのQGISのアイコンにドラッグ&ドロップします。
(地図が表示されるのに、かなり時間がかかります)
以後は繰り返しの作業ですが、
念のため記述します。

ベクタを選択し、
マウスカーソルを空間演算ツールに移動すると表示される
融合(dissolve)を選択します。

赤枠(四角)を選択します。

『N03_001』と『N03_002』を選択し、
『OK』ボタンを押下します。

赤枠(四角)ボタンを押下し、
『ファイルに保存』を選択します。

エクスプローラーが表示されますので、
指定のフォルダに名前とファイル形式を選択して保存します。
(この段階では保存されません)
(この段階で最初に作業したQGISが開いたままだった場合は閉じてください)
(ファイル名は拡張子『なし』で作成してください)


『実行』ボタンを押下します。

『終了しました』と表示されたら、
『閉じる』ボタンを押下します。


できたっぽいです。
これをPythonで作成します。

import geopandas as gpd
import pandas as pd
import matplotlib.pyplot as plt
%matplotlib inline
japan = gpd.read_file("/home/yasube873/Python/weather/map/japan_map.shp", encoding='utf-8')
display(japan)
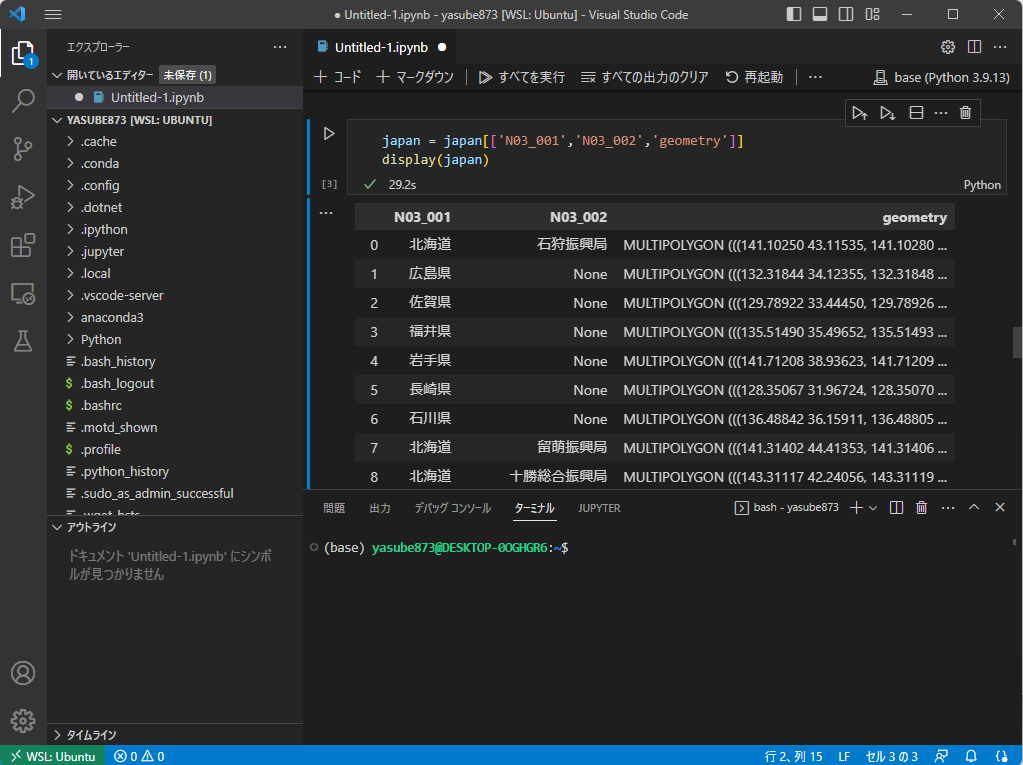
japan = japan[['N03_001','N03_002','N03_007','geometry']]
display(japan)

fig, ax = plt.subplots(figsize = (20,16))
japan.plot(ax=ax, facecolor='white', edgecolor='black', linewidth=0.5)
plt.show()

できました。
琵琶湖や霞ケ浦がないのが気になりますが、
とりあえずここまでで良しとします。
0 件のコメント:
コメントを投稿